Dividend Tracker Spreadsheet vs App: Which One Should You Use?
Many dividend investors start with a spreadsheet, then wonder if an app would save them time. This guide compares both ways to track dividends so you can pick the one that fits your portfolio.

Almost every dividend investor starts tracking income in a spreadsheet. It's free, it's flexible, and it feels like full control: a row for each stock, a column for the share count, another for the annual dividend, and a formula that adds it all up. For a handful of holdings, that works well. But as the portfolio grows, the spreadsheet starts asking for more of your time, and the numbers become harder to trust.
A dividend tracker app takes the opposite approach. Instead of building the model yourself, you add your holdings once and the app keeps prices, dividend dates and payouts up to date for you. Neither option is right for everyone. This guide compares a dividend tracker spreadsheet with a dividend tracker app across the things that matter most, so you can decide which one fits the way you invest. If you are still deciding whether you need a tracker at all, start with our article on why every investor needs a dividend tracker.
What a Dividend Tracker Spreadsheet Does Well
A spreadsheet's biggest strength is freedom. You decide which columns exist, how each metric is calculated and how the data is laid out. If you want a custom view, such as income by sector, a personal "safety score" or a goal for each year, you can build it in minutes without waiting for anyone to add a feature.
Spreadsheets are also free and familiar. Excel and Google Sheets are already on most computers, and there is nothing new to learn. Your data stays in a file you own, which some investors prefer for privacy. And for a small portfolio of five or ten stocks that you rarely trade, a simple sheet can be all you need.
What to Include in a Dividend Tracker Spreadsheet
If you build your own sheet, give each holding one row with these columns:
- Ticker and company name: what you own.
- Shares: how many shares you hold.
- Cost basis: what you paid in total, needed for yield on cost.
- Dividend per share: the latest declared amount.
- Frequency: monthly, quarterly, semi-annual or annual.
- Ex-dividend date and pay date: when you have to own the shares and when the cash arrives.
- Annual income: shares × dividend per share × payments per year.
- Dividend yield and yield on cost: annual dividend divided by today's price and by your cost basis.
The first three columns change only when you trade. Everything from dividend per share onward changes on its own, every time a company declares a dividend or the price moves, and in a spreadsheet you have to update it by hand.
Where Spreadsheets Fall Short
The problems start with dividend data. Price formulas such as Google Sheets' GOOGLEFINANCE can fill in share prices, but they don't give you dividend history, ex-dividend dates or payment dates. That means you look up each declaration yourself, type in the amount and the dates, and repeat it every quarter for every holding. With 30 or 40 stocks, that's well over a hundred manual updates a year.
Accuracy is the second issue. Whether you receive a dividend depends on how many shares you held on the ex-dividend date, not on how many you hold today. A basic spreadsheet multiplies the current share count by the dividend, so every buy or sell between the ex-dividend date and the payment date makes the result wrong. Stock splits, special dividends, reinvested dividends (DRIP) and currency conversion all need extra formulas, and each one is another place where a small mistake can quietly spread through the whole sheet.
Finally, spreadsheets are hard to use on the go. Checking upcoming income or adding a trade on a phone means scrolling through tiny cells, and there's no way to get a notification when a dividend is announced or paid.
What a Dividend Tracker App Does Differently
A dividend tracker app is built around dividend data rather than around a grid of cells. You add your holdings by entering transactions, uploading a CSV file from your broker or connecting your brokerage account, and the app takes care of the rest: current prices, announced and estimated dividends, ex-dividend and payment dates, and metrics such as dividend yield and yield on cost.
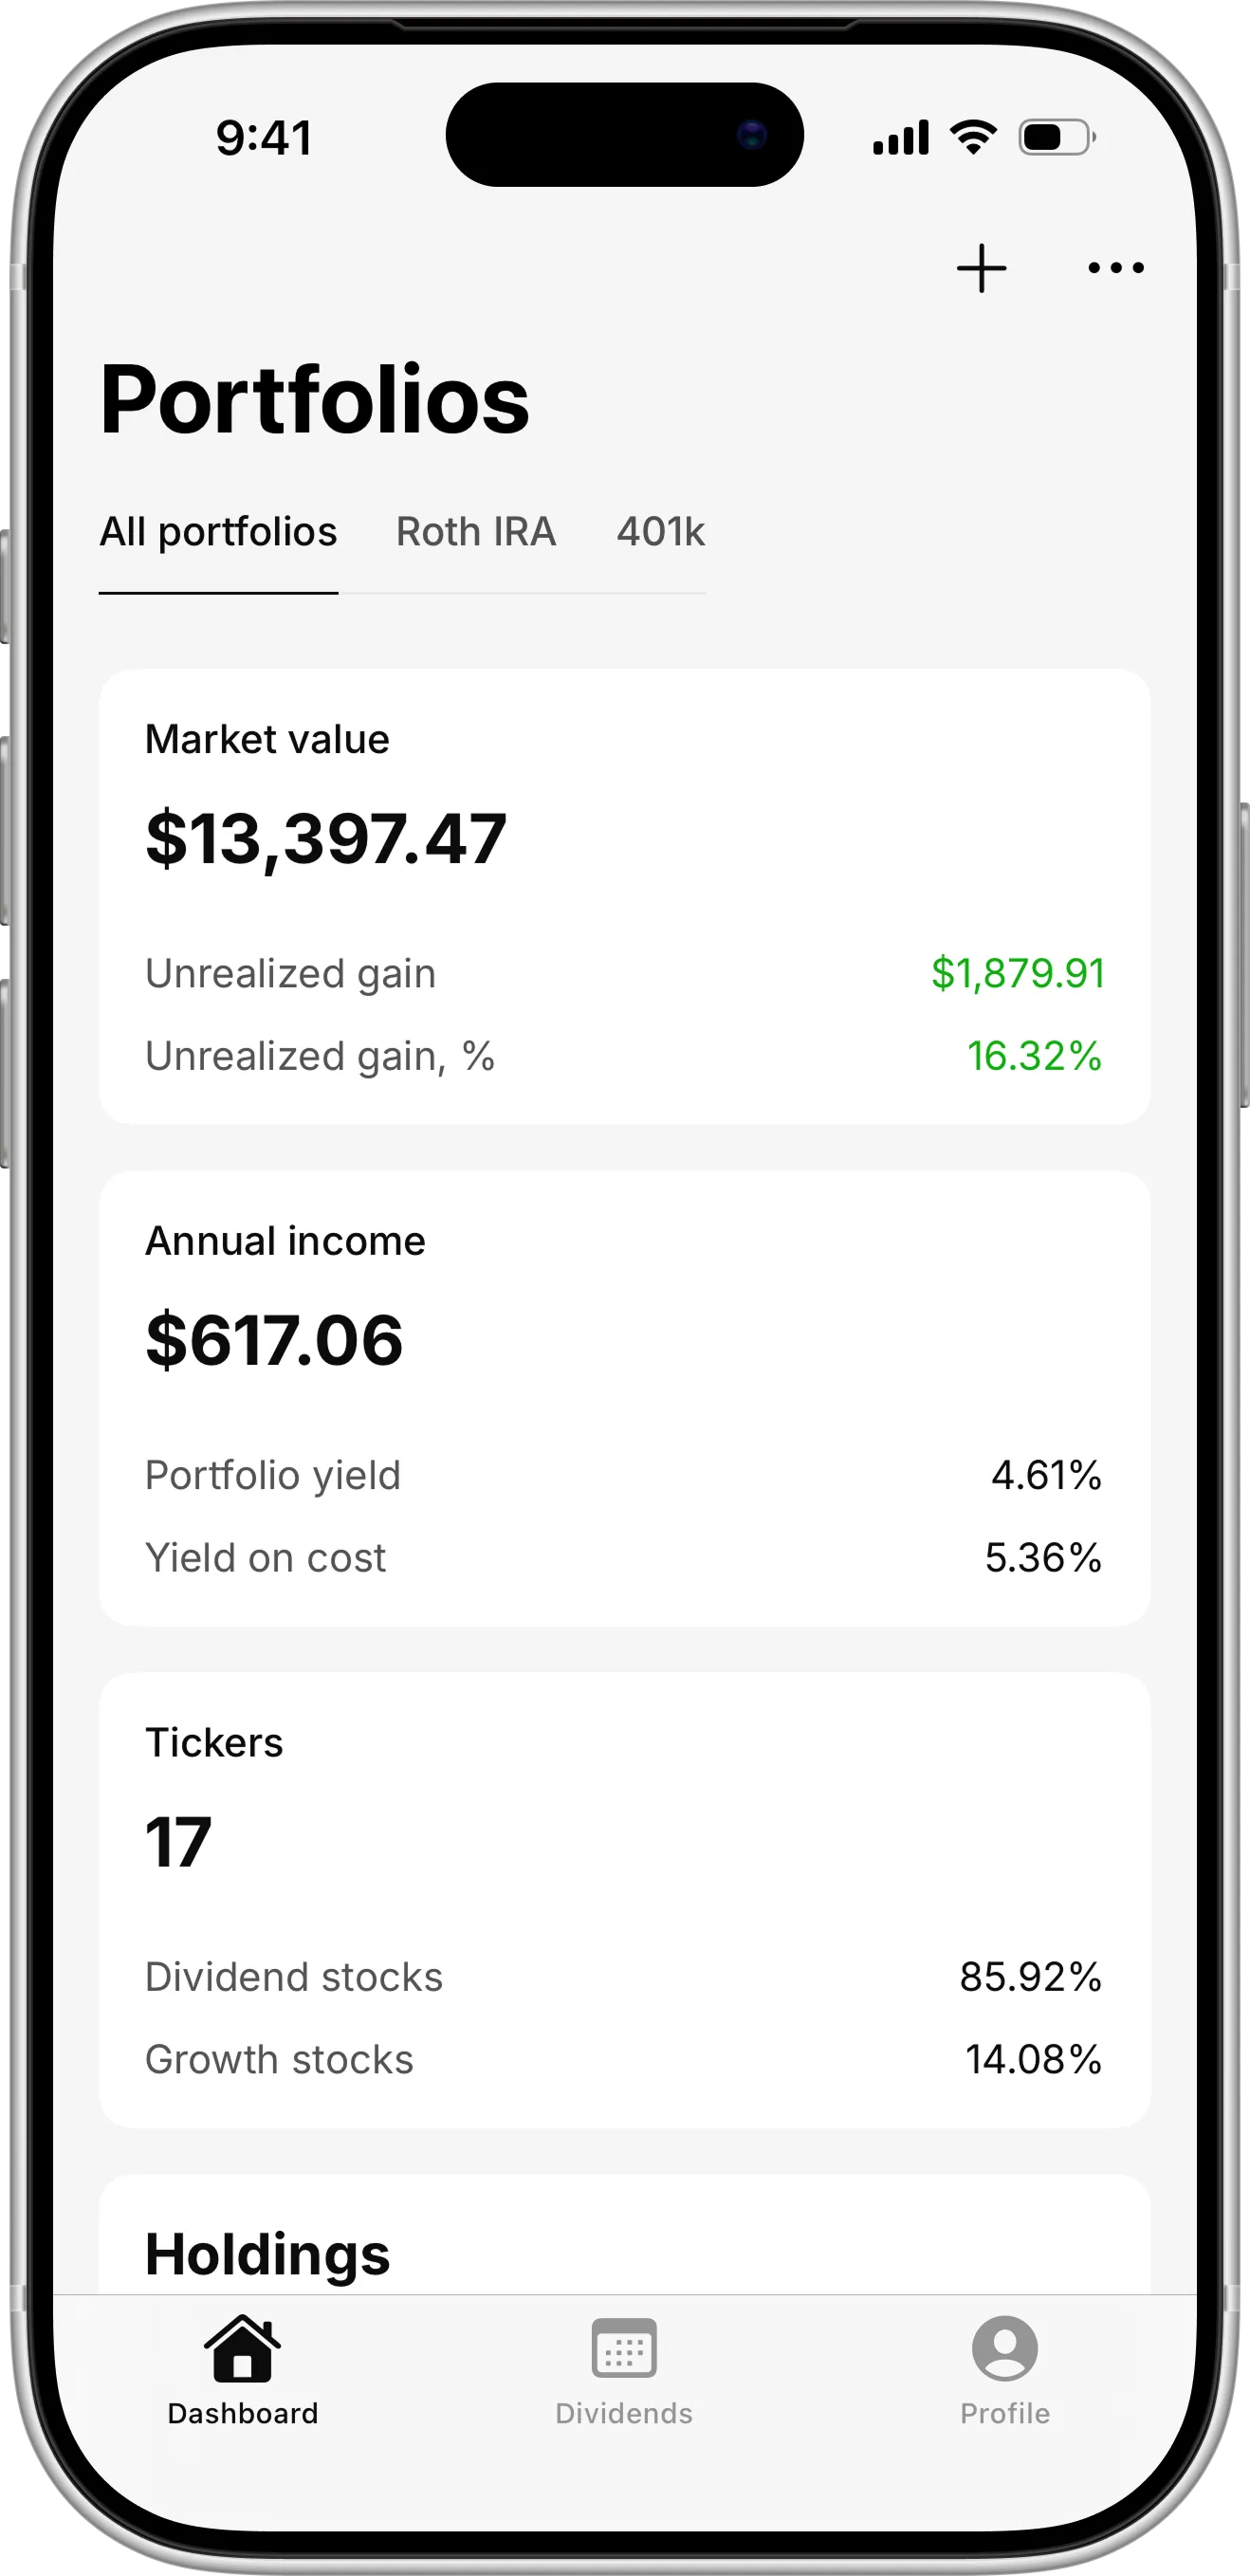
Plainzer's dashboard: market value and unrealized gain, annual dividend income with portfolio yield and yield on cost, and the split between dividend and growth stocks. Every number updates on its own, so there are no formulas to maintain.
Because the app knows your full transaction history, it can work out how many shares you held on each ex-dividend date and calculate every payout correctly. We explain why that matters in open positions vs full history. Splits and DRIP are adjusted automatically, holdings in different currencies are converted for you, and a dividend calendar shows what you will receive in the coming months. Most apps also work on your phone and can alert you when a payout is announced or arrives.
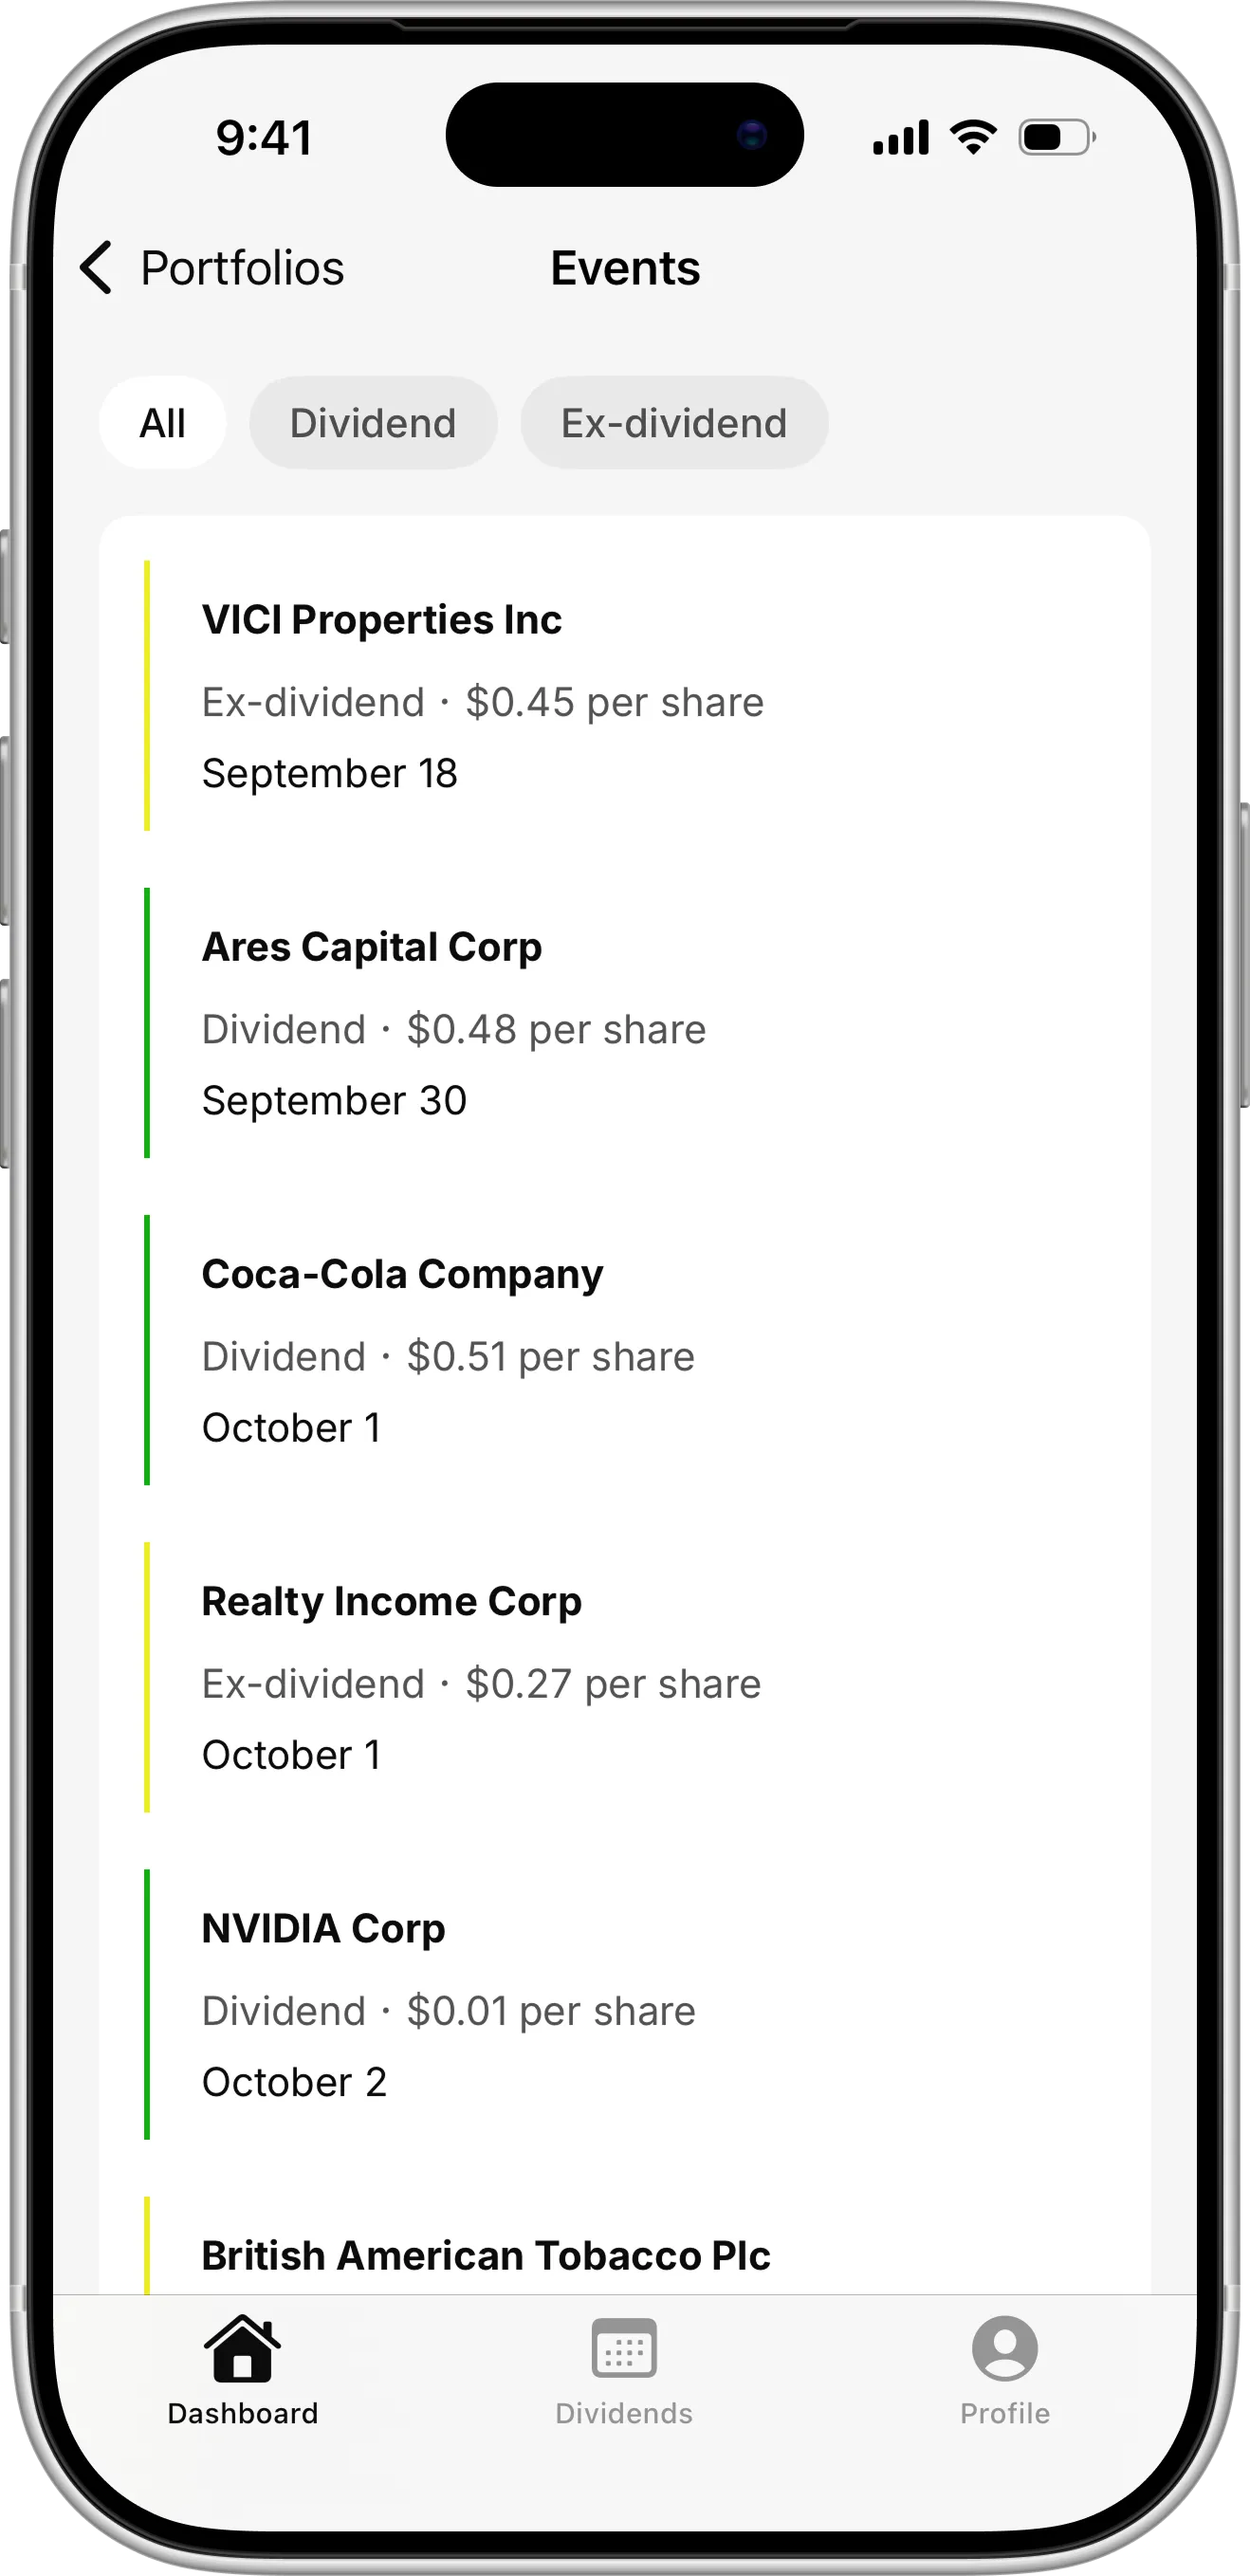
The Events screen lists upcoming ex-dividend and payment dates for each holding, with the amount per share. In a spreadsheet, you would look up each of these dates and amounts yourself.
The trade-off is flexibility. An app shows the metrics its developers chose, so if you rely on a very specific custom calculation, you may still want to keep a small spreadsheet next to it. Advanced features may also come with a subscription, although many trackers offer a free plan. If you're worried about privacy, check what a brokerage connection can access. In Plainzer, brokerage linking is read-only: the app can see your holdings and transactions, but it can't place trades or move money.
Spreadsheet vs App: Side-by-Side Comparison
In short, a spreadsheet trades your time for control, while an app trades some control for automation:
| Spreadsheet | Dividend tracker app | |
|---|---|---|
| Setup | Every holding typed in by hand, in a layout you design yourself | Holdings imported from a CSV file or synced from your brokerage |
| Upcoming dividends | You look up each amount and date yourself | Confirmed and estimated payouts shown automatically |
| Accuracy | Usually based on today's share count | Based on the shares you held on each ex-dividend date |
| Splits, DRIP and currencies | Manual adjustments and extra formulas | Handled for you |
| Upkeep | Regular data entry and formula fixes | Updates on its own |
| Mobile and alerts | Hard to use on a phone, no alerts | Mobile apps and notifications |
| Customization | Calculates anything you want | Limited to the metrics the app offers |
| Cost | Free, apart from your time | Free plans and paid subscriptions |
Which One Should You Choose?
A spreadsheet makes sense if you hold only a few stocks, trade rarely, enjoy building your own models and don't mind updating dividend data by hand. It's also a good way to learn how dividend income is calculated before you hand that work to software.
A dividend tracker app is the better choice once your portfolio grows beyond a couple of dozen positions, spans more than one brokerage or currency, or uses DRIP. It's also the better choice if you want an accurate forecast of future income without spending a weekend each quarter checking announcements.
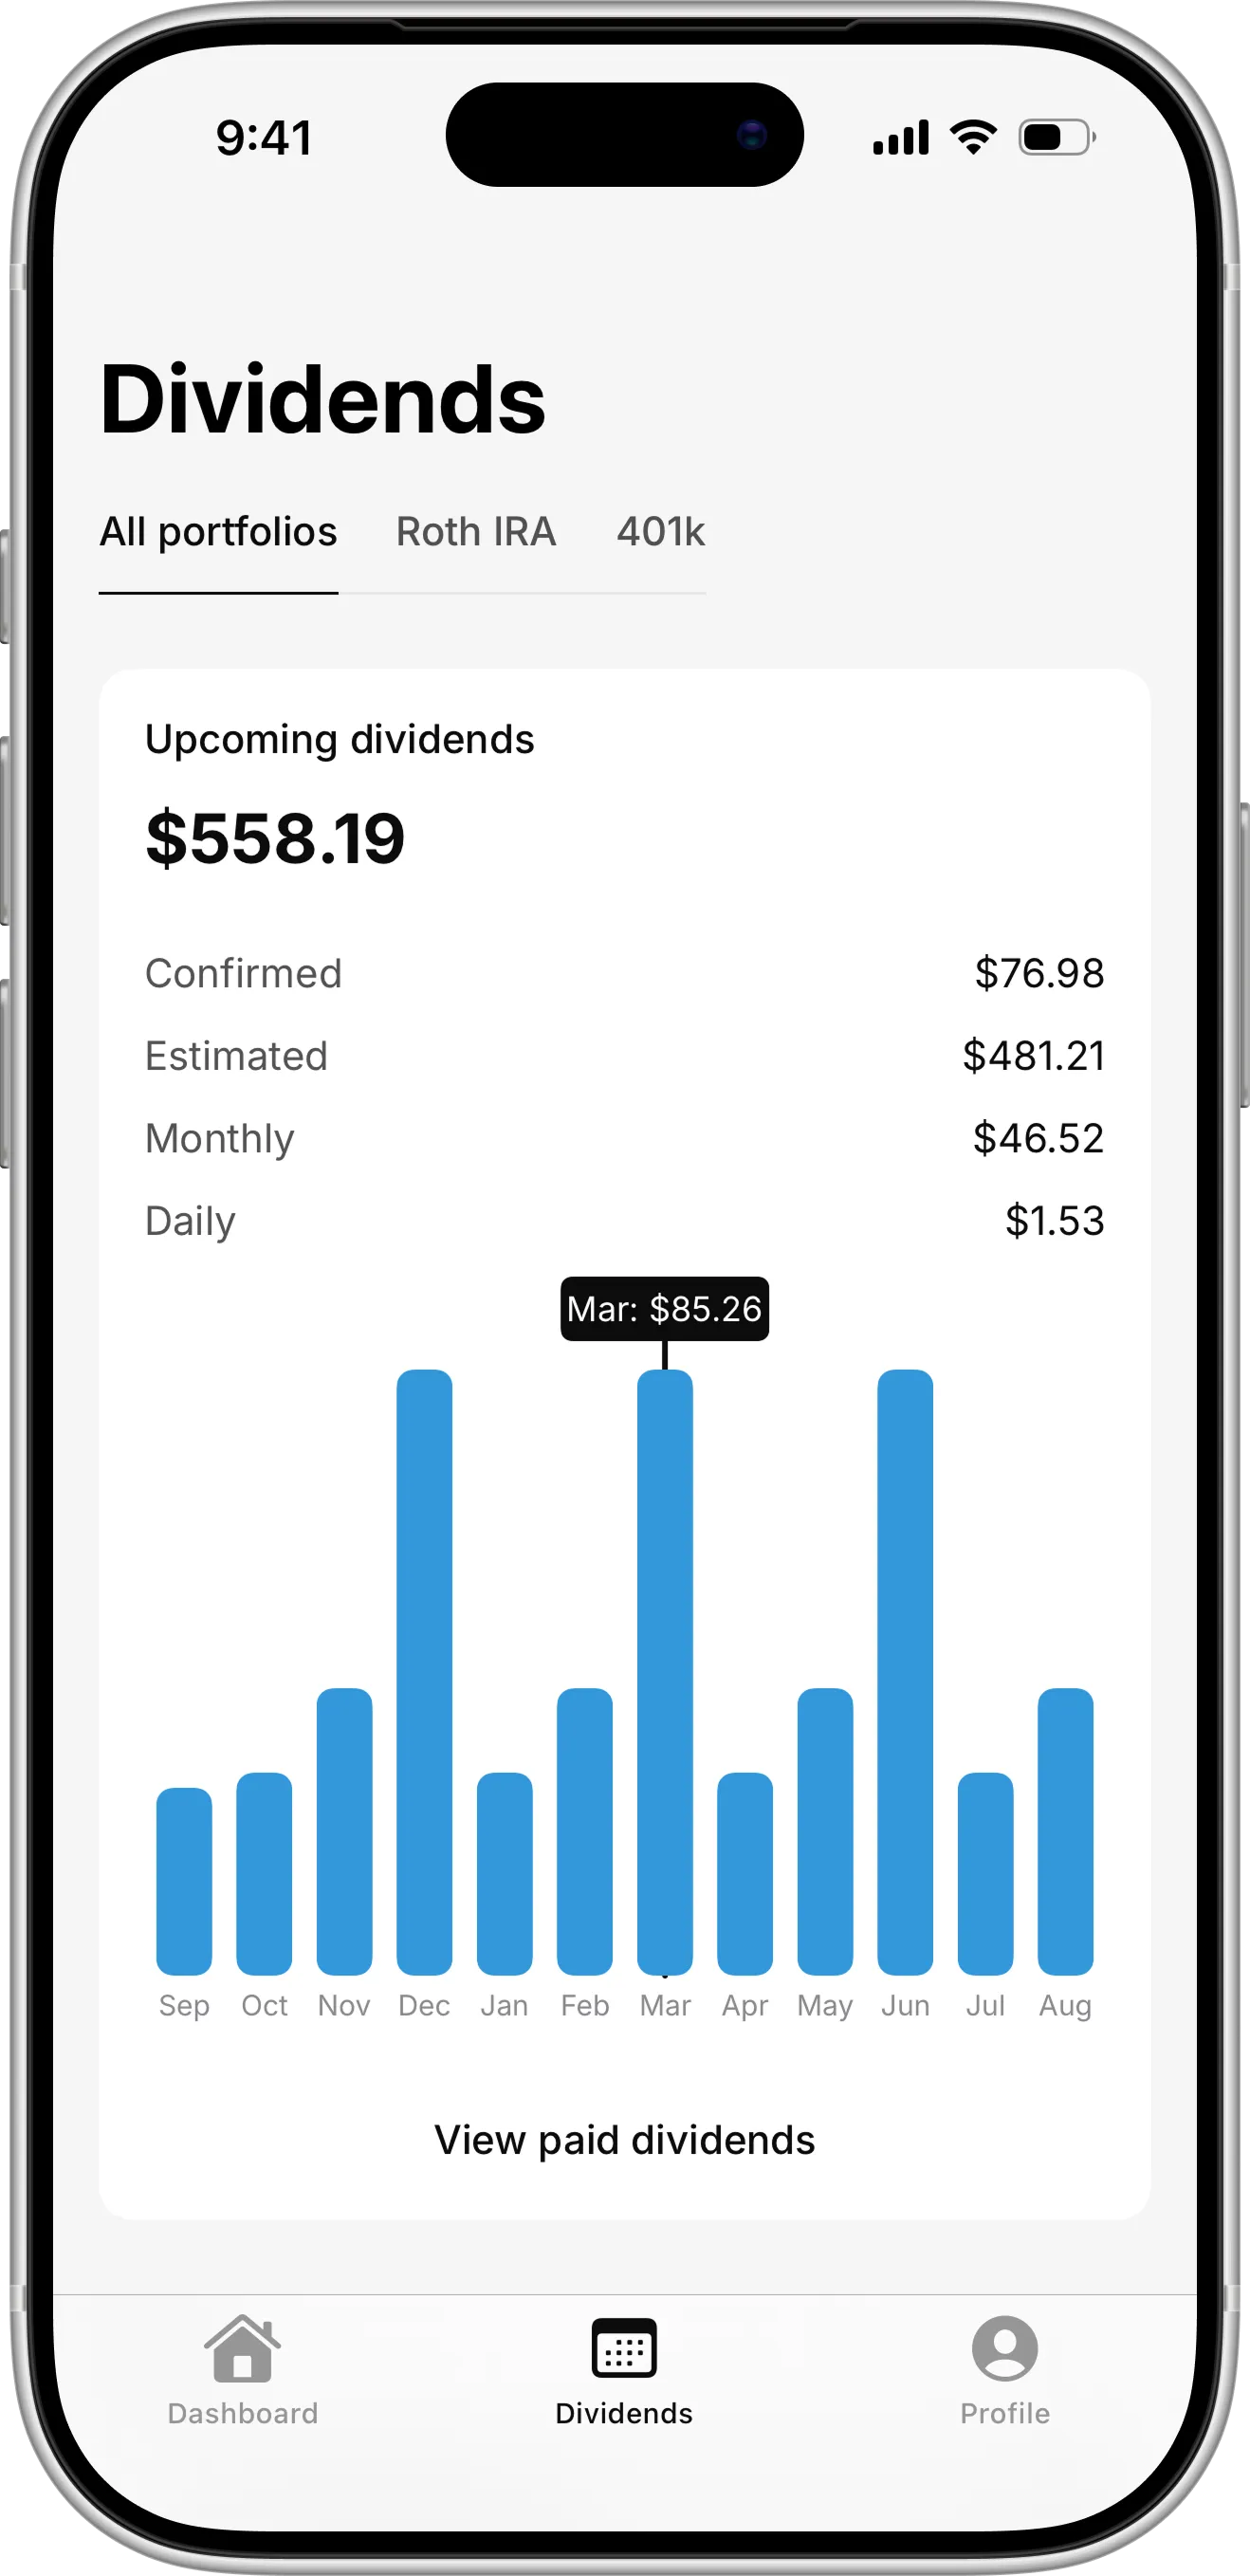
Upcoming dividends for the next 12 months, split into confirmed and estimated payouts, with monthly and daily averages and a chart of income by month.
Many investors take a middle path: they move day-to-day tracking into an app and keep a small spreadsheet for the one or two custom calculations they can't do without.
How to Move From a Spreadsheet to an App
Switching doesn't mean starting over. The easiest way is to connect your brokerage account to the app, so your holdings and trades come in automatically. If your broker isn't supported, export your transaction history as a CSV file instead. That file is usually a better starting point than your spreadsheet, because it includes every buy and sell with its date. Import it into the app, check that the share counts match your broker, and then add any older trades that the export doesn't cover.
If you only have current positions, you can begin with those and add past transactions over time. Your dividend history and forecasts become more accurate with each trade you record. Keep your old spreadsheet until the totals in the app match what your broker actually paid you, and then retire it.
Frequently Asked Questions
Can Google Sheets track dividends automatically?
Only partly. The GOOGLEFINANCE function can fill in share prices, but it doesn't return dividend history, ex-dividend dates or payment dates. To get those into a sheet you need to enter them by hand, use a third-party add-on, or import data from an external source.
Is a dividend tracker spreadsheet accurate?
It can be, but only if you record every transaction and calculate each payout from the shares held on the ex-dividend date. Most simple templates multiply today's share count by the dividend, which gives wrong results whenever you buy or sell around an ex-dividend date.
Is there a free dividend tracker app?
Yes. Many dividend trackers, including Plainzer, have a free plan. Plainzer's free plan includes one portfolio with a limited number of transactions, while paid plans add more portfolios, brokerage linking and features such as payout notifications. See Plainzer pricing for what each plan includes.
Can I import my dividend spreadsheet into an app?
Usually, yes. Most trackers accept a CSV file of transactions. Plainzer has ready-made templates for popular brokerages such as Charles Schwab, Fidelity, Interactive Brokers and Robinhood, so you can upload your broker's export as it is. If you track your trades in a spreadsheet, copy them into Plainzer's own CSV template and import that. Importing transactions instead of only current positions gives you the most accurate dividend history.
Conclusion
Spreadsheets and dividend tracker apps solve the same problem in different ways. A spreadsheet gives you complete control, but it costs time, and its accuracy depends on how carefully you maintain it. An app takes over the repetitive work of looking up dividends, adjusting for splits and DRIP and forecasting future income, and gives up some flexibility in return. If your spreadsheet has started to feel like a second job, it's probably time to switch. The Plainzer dividend tracker is free to start and works on the web, iOS and Android. It imports your holdings from a CSV file, using a template for your brokerage or Plainzer's own, and shows your confirmed and estimated dividends for the next 12 months. Paid plans add automatic sync with 20+ brokerages. To see which stocks go ex-dividend soon, check the dividend calendar.